Rheology Calculator
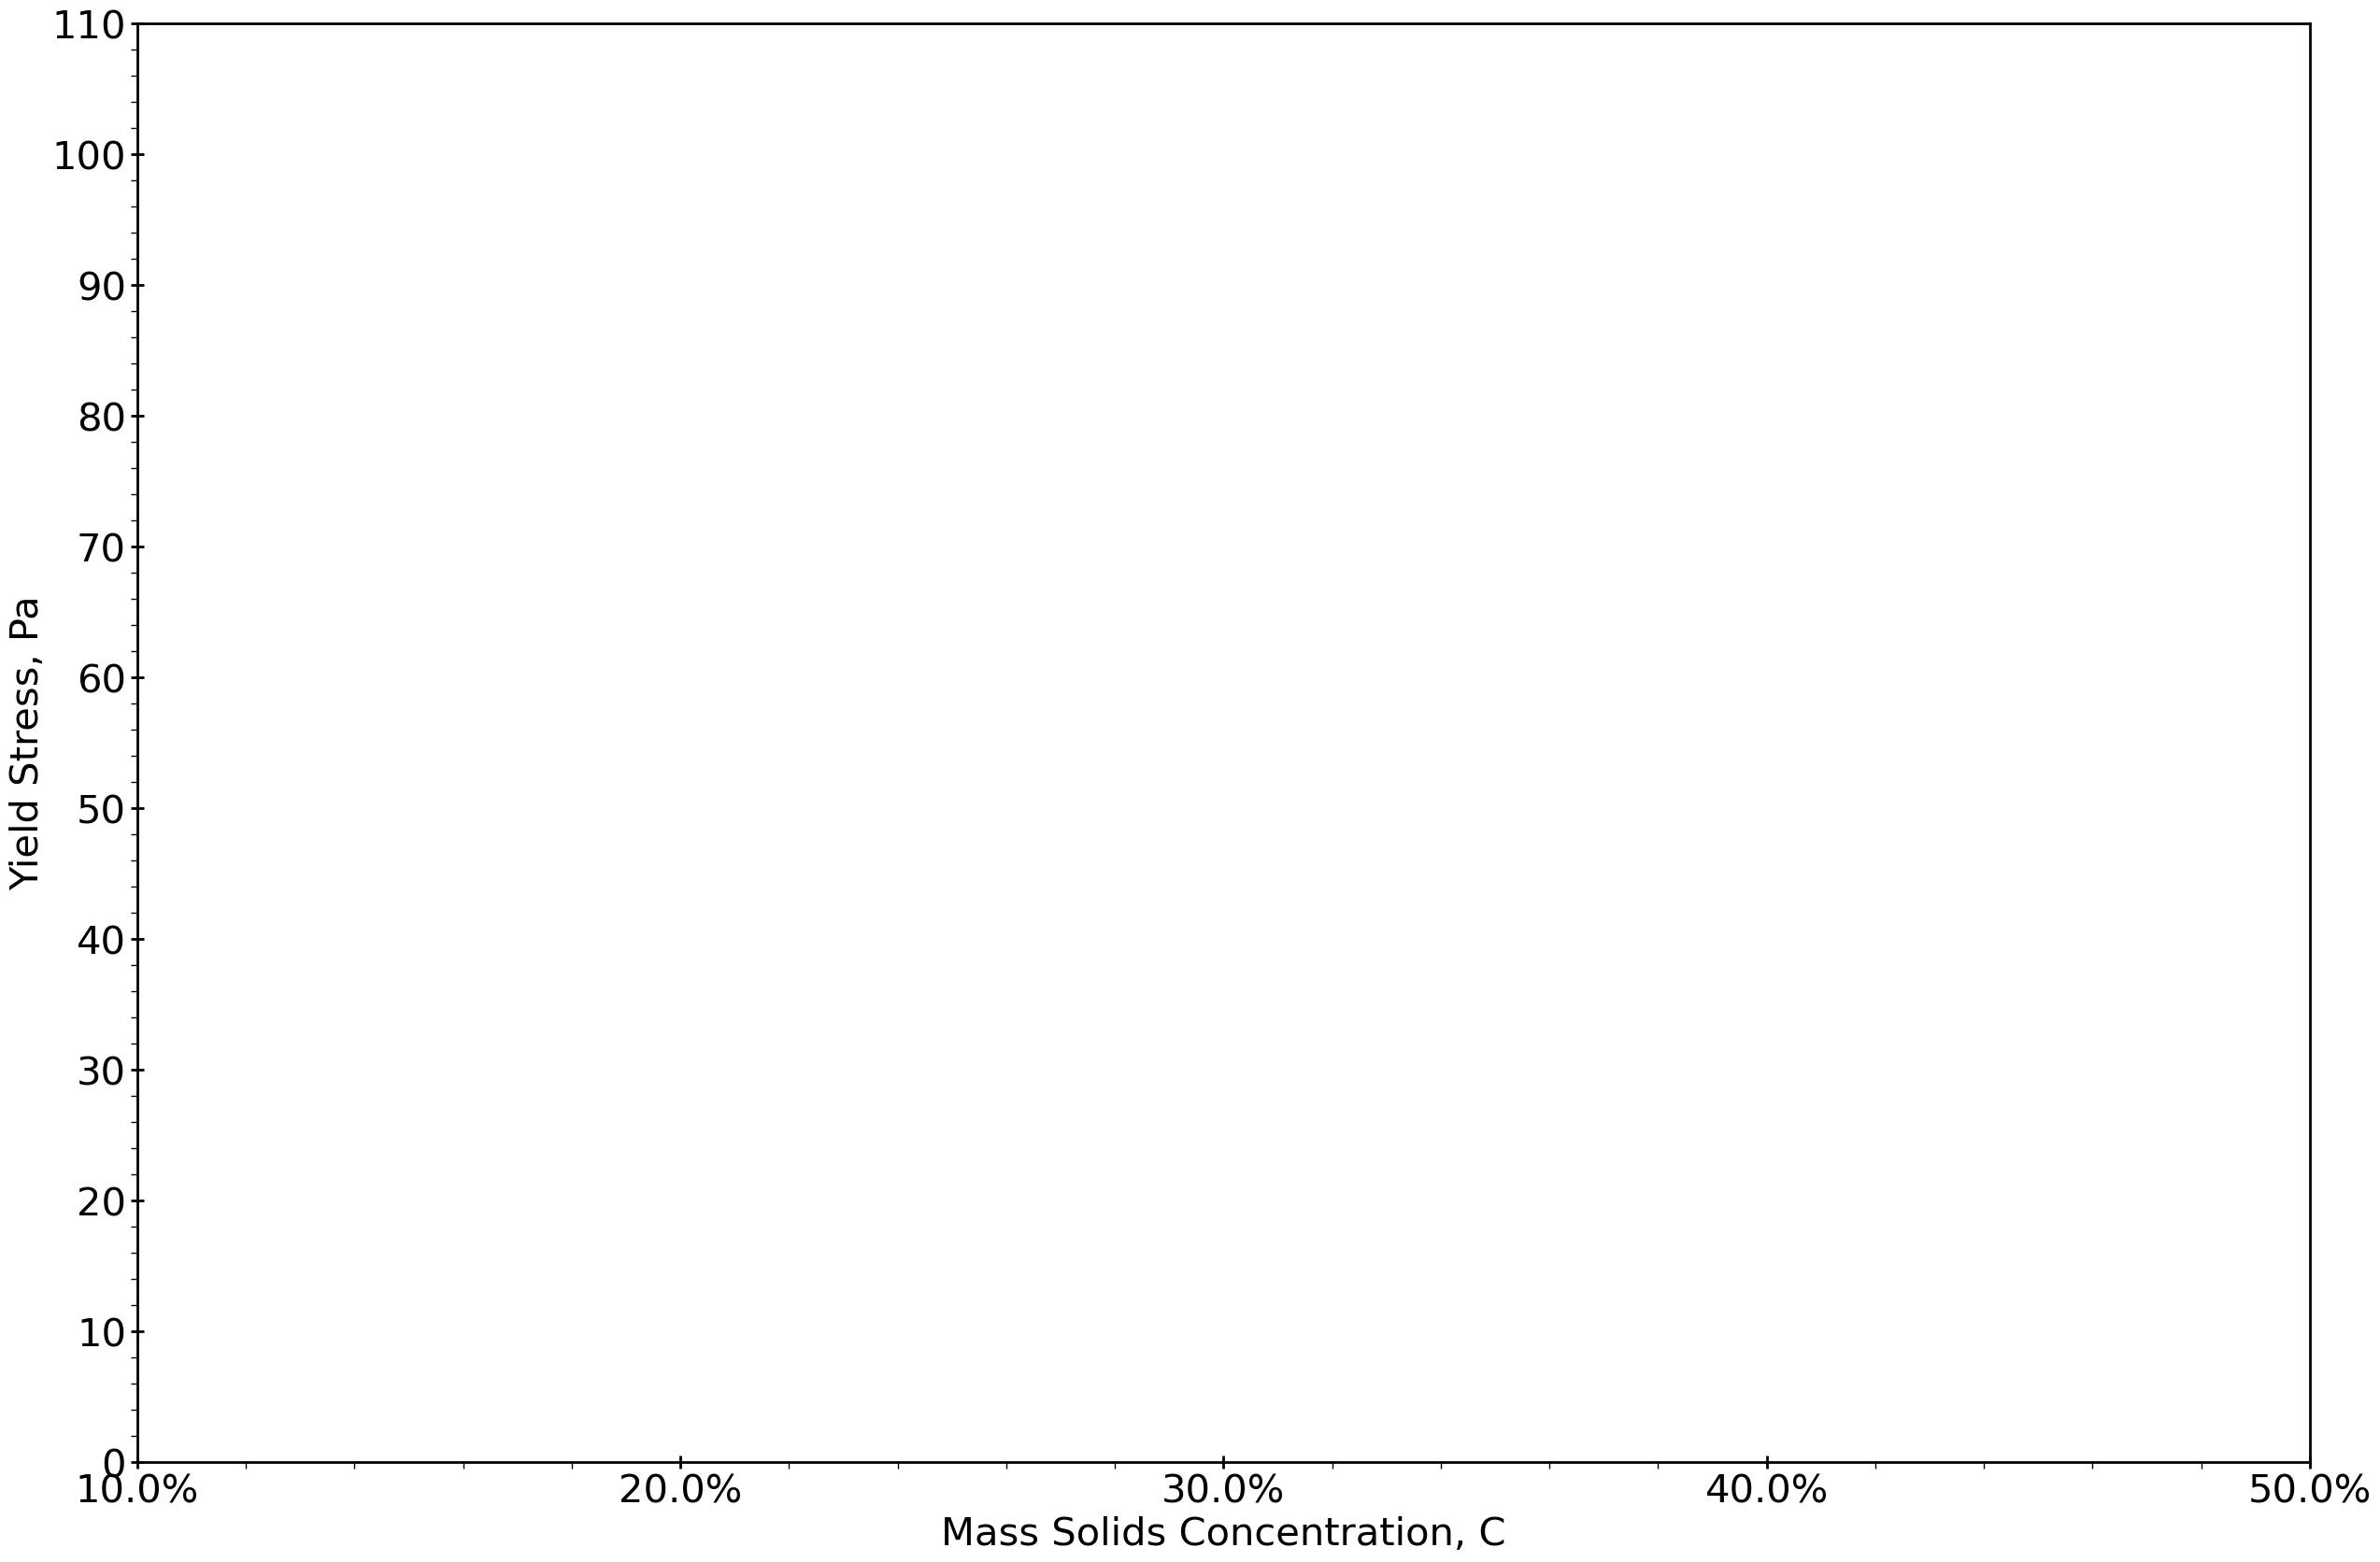
Full Fraction Yield Stress

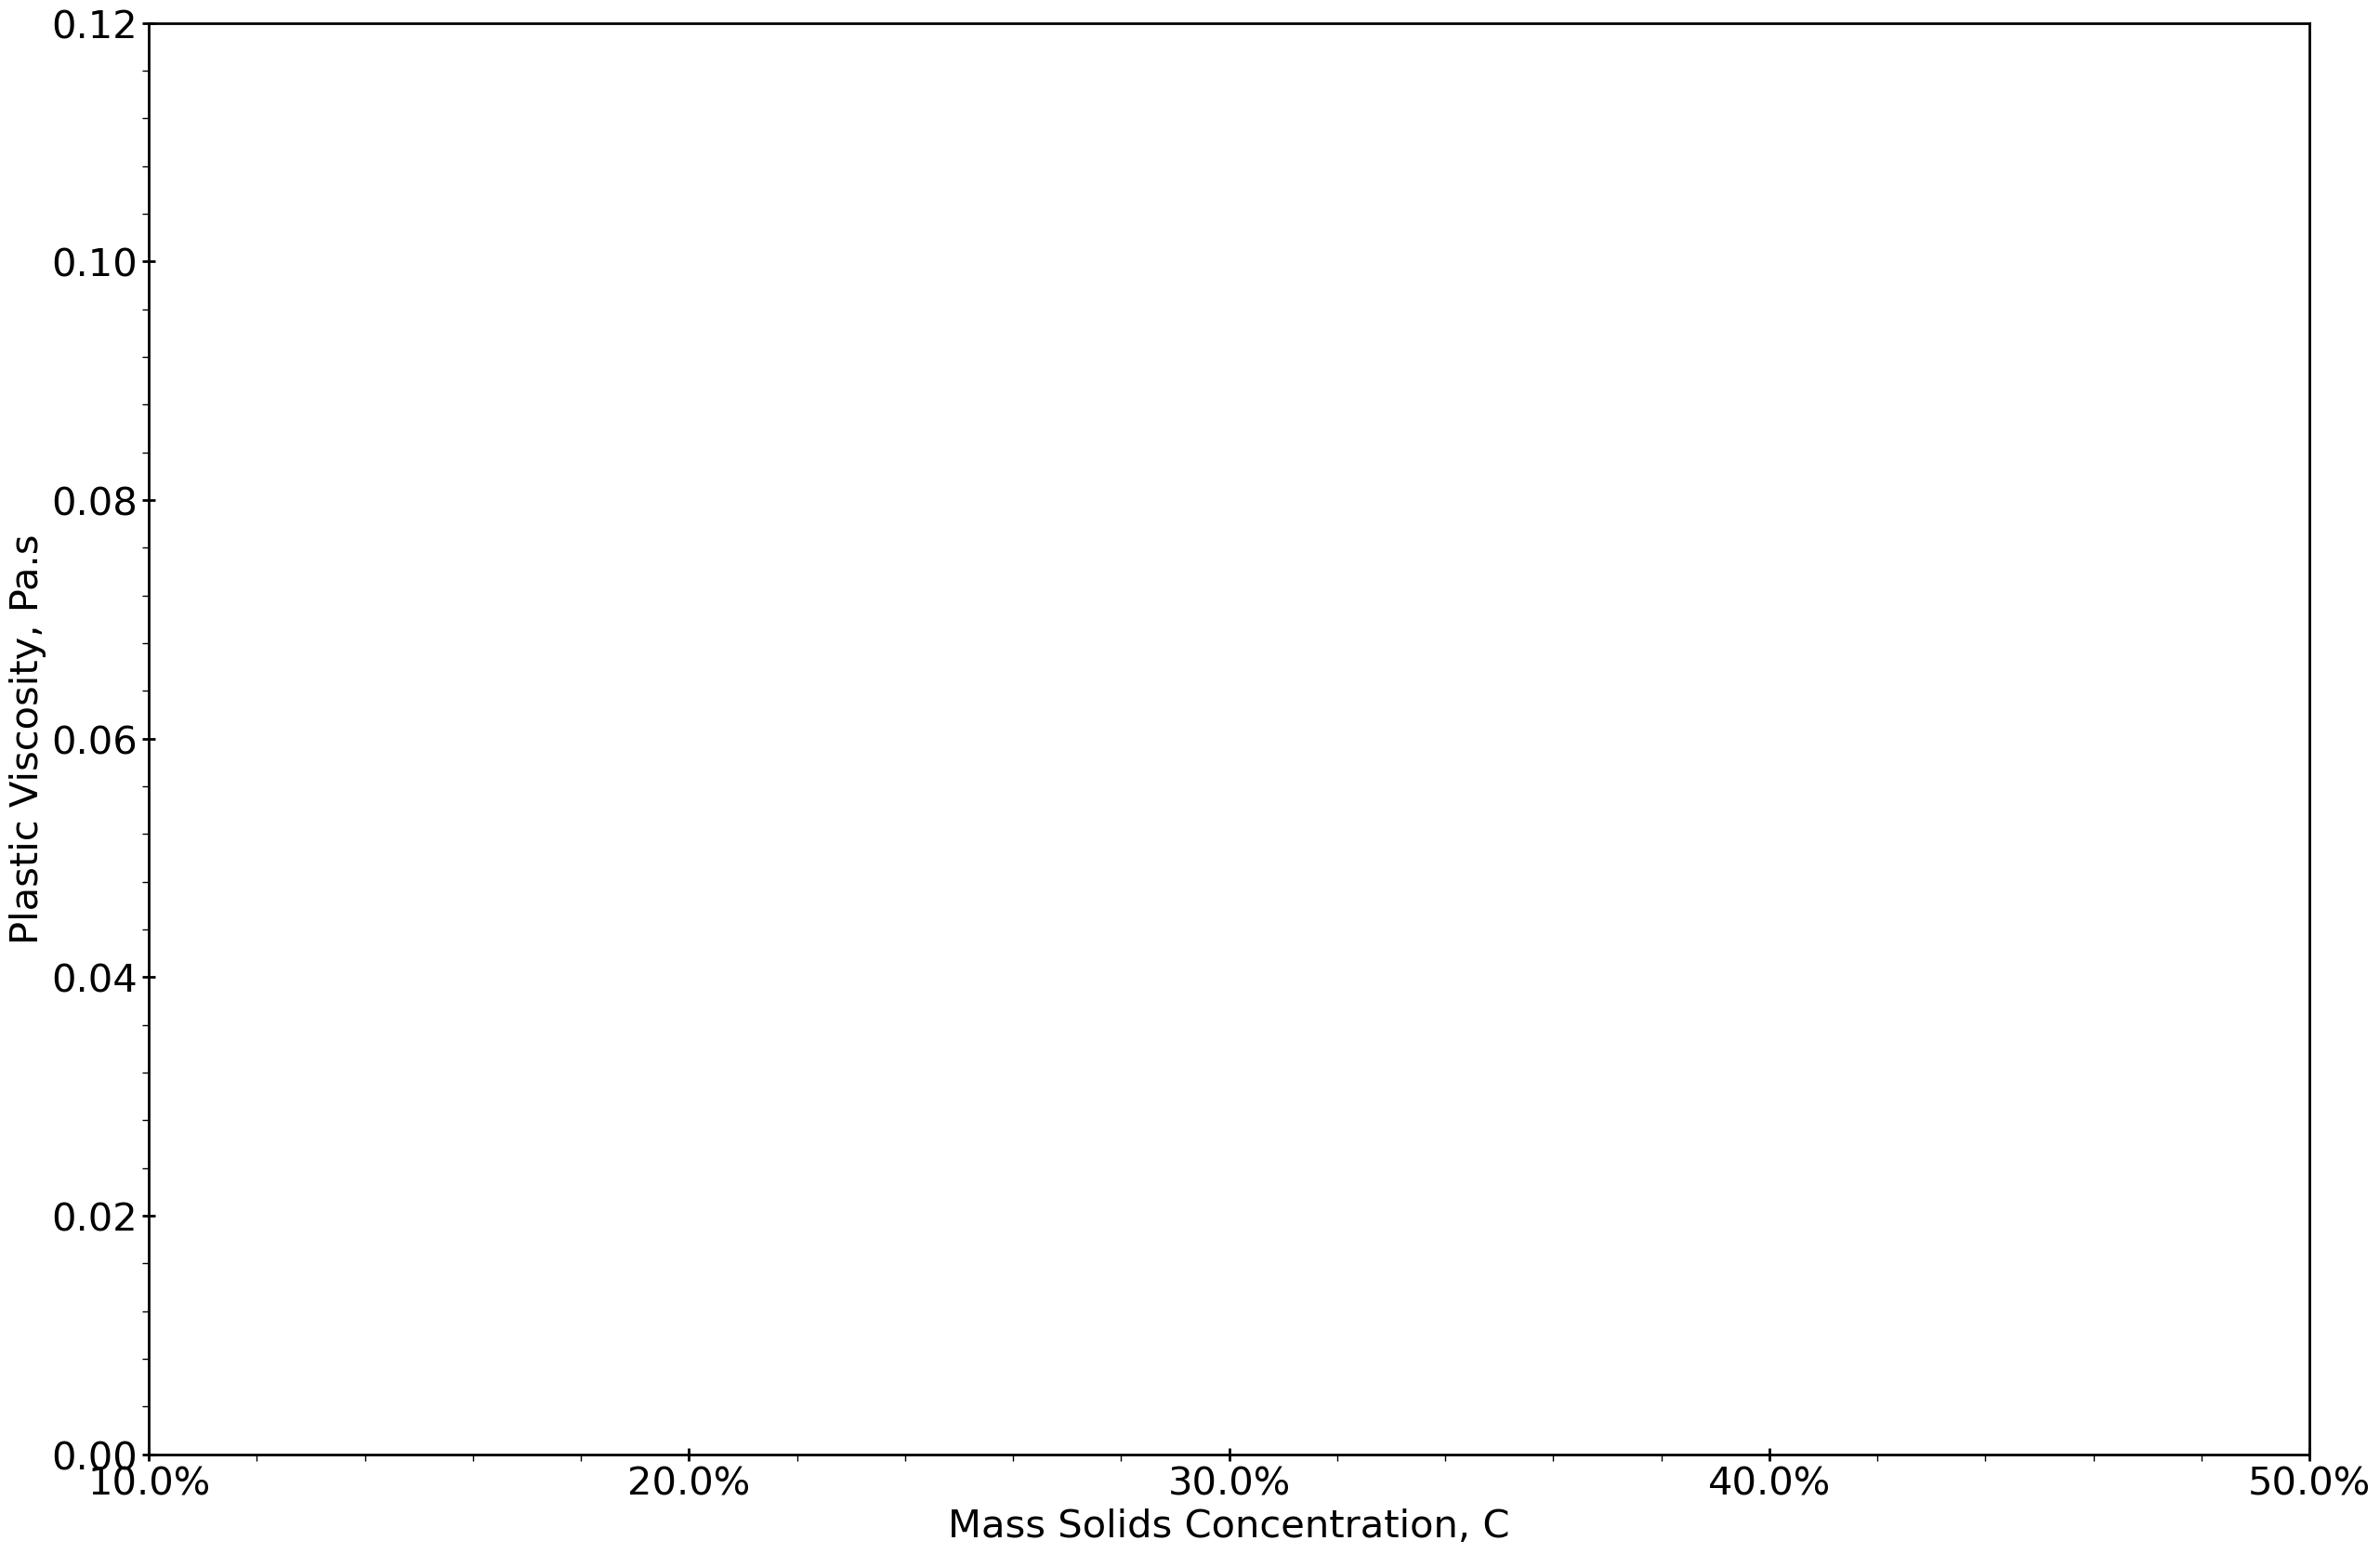
Full Fraction Plastic Viscosity

Rheology Fundamentals
Slurry rheology is critical for designing efficient pipeline transport systems, as it describes how the slurry will flow under different conditions.
Key Rheological Parameters:
- Yield Stress (Pa): Represents the minimum applied stress required to initiate flow. Below this threshold, materials exhibit solid-like behaviour. For example, the initial resistance felt when stirring a tin of paint.
- Plastic Viscosity (Pa·s): Quantifies resistance to flow after the yield stress has been exceeded. Examples of high viscosity samples would be honey, which presents a high amount of resistance to flow.
Models and Equations
The rheology calculator implements the Herschel-Buckley model which accounts for both yield stress and shear-dependent viscosity of Newtonian and non-Newtonian slurries. These parameters are essential for predicting pressure losses in pipelines, determining minimum transport velocities, and selecting appropriate pumping equipment.
The Herschel-Buckley model, can be mathematically expressed as:
- τ = shear stress (Pa)
- τy = yield stress (Pa)
- K = consistency index (Pa·sn)
- γ̇ = shear rate (s-1)
- n = flow behavior index (dimensionless)
Rheogram Analysis

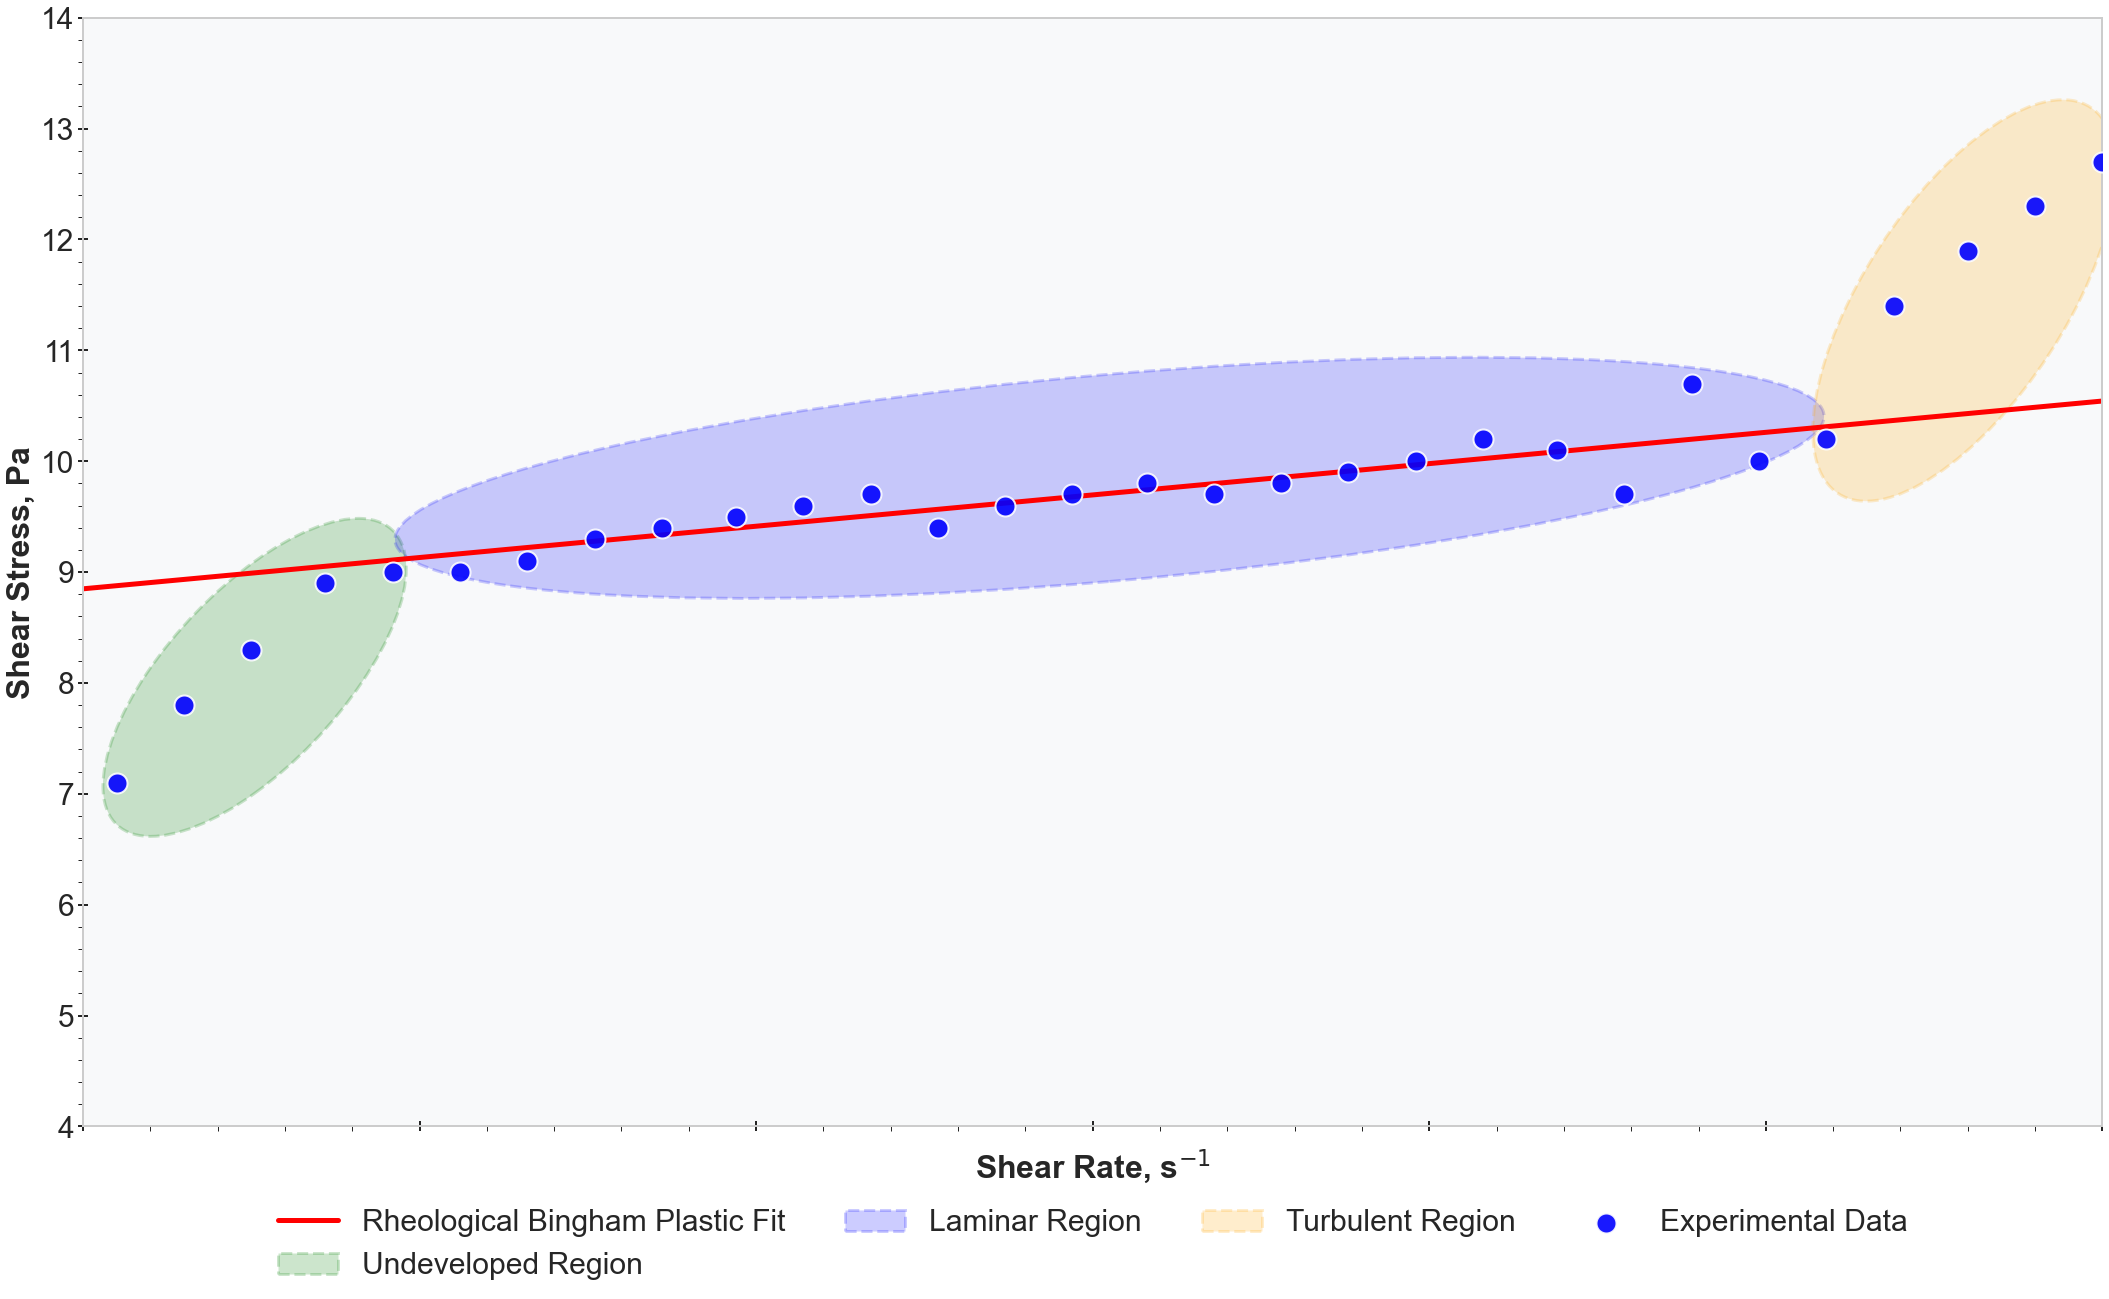
Using the Bingham plastic model the yield stress and plastic viscosity parameters can be calculated from either rotaional viscometer and/or pipeline loop testing. The typical standard for the rotational viscometer test is ISO3219. The image above illustrates a typical rheogram for a Bingham plastic fluid. From this rheogram we can gather the following:
- Plastic Viscosity (Pa.s): The linear gradient of the laminar portion of the rheogram (highlighted in blue).
- Yield Stress (Pa): The y-intercept represents the yield stress. The linear gradient is extended from the laminar region to the y-intercept to determine the yield stress component.
- Undeveloped Region: The section of the rheogram where the shear rate is too low to overcome the yield stress (highlighted in green). In this region, the material behaves more like a solid than a fluid.
- Turbulent Region: The part of the rheogram where the shear rate is too high to maintain laminar flow (highlighted in orange). In this region, the flow becomes chaotic and unpredictable, requiring different mathematical models.
Settling Slurries
- Particle size distribution (larger particles settle faster)
- Particle density (denser particles settle faster)
- Carrier fluid viscosity (more viscous fluids slow settling)
- Solids concentration (higher concentrations can hinder settling)
The Testing Challenge: When analyzing settling slurries, solid deposition can produce erroneous rheological results, particularly when the slurry becomes too dilute to maintain particles in suspension.
The Solution - Fines Fraction Testing: To obtain accurate rheological measurements, the fines fraction (particles smaller than 45 microns) is isolated through wet sieving and tested separately. This approach works because:
- The fines fraction significantly increases slurry viscosity and drives rheological behavior
- Particles larger than 75 μm contribute minimally to rheology and tend to settle at lower velocities
- Testing the fines in isolation eliminates settlement issues during rheological measurement
Important Note: While coarser particles in isolation provide minimal rheological effects, they do contribute to the overall rheology of the full fraction slurry when combined with fines. The interaction between coarse and fine particles creates a more complex rheological system than either fraction alone.
From the fines fraction results, full-fraction rheology can be reconstructed by incorporating additional parameters:
- Solids density: The mass per unit volume of the solid particles
- Percentage fines: The proportion of particles smaller than 45 microns in the overall slurry
- Cbmax: The maximum packing volume concentration (approximately 64% by volume for mono-sized spheres, but varies with particle shape and size distribution)
These parameters allow for accurate prediction of both yield stress and plastic viscosity for the complete slurry, accounting for the contribution of both fine and coarse particles.